5/1/2024
The Transient Effects of Indoor Lighting on Lettuce Production
Nathan Kelly & Erik S. Runkle
Environmental parameters for indoor leafy greens—especially temperature, carbon dioxide (CO2) concentration, light intensity and light spectrum—regulate yield and crop quality. Considering indoor production typically utilizes lower-light intensities compared with that of outdoor production, techniques are needed to enhance plant nutritional quality and coloration.
To accomplish this, light-emitting diodes (LEDs) can be used to deliver specific wavelengths of light, such as UVA (315-400 nm) and blue (400-499 nm), to target the production of nutritious phenolic compounds, as well as color-causing compounds such as anthocyanins. While these wavebands can improve plant quality, they also inhibit leaf area and plant size, which typically limit the harvestable yield. Therefore, it’s important to determine when UVA or blue light needs to be applied to improve plant quality without diminishing yield.
While in other research (see our last article in the Spring Inside Grower) we found end-of-production (EOP) lighting increased plant quality, we wondered whether applying it for a longer duration—or even during the entire production cycle—would further increase nutritional quality and coloration. Furthermore, we didn’t know if applying UVA or blue light during the seedling stage or the middle of the production cycle had lasting effects on plant quality at harvest. Therefore, the objectives of this study were to determine when UVA or blue light should be elevated during the production cycle to enhance red-leaf lettuce coloration and nutritional quality without diminishing yield.
Study design
Similar to our previous article, we used red-leaf lettuce Rouxai because of its commercial relevance and sensitivity to the light spectrum. Seeds were sown in pre-soaked 200-cell rockwool sheets and germinated at a temperature of 74F (23C) and under 180 µmol∙m–2∙s–1 of continuous light provided by warm white LEDs in the Controlled-Environment Lighting Laboratory (CELL) until Day 4.
Four days after seed sow, lettuce seedlings were separated into 10 different groups where they were grown under 150 µmol∙m–2∙s–1 of 50% warm-white LEDs (color temperature of 2,700K) and 50% red LEDs (peak wavelength of 660 nm), plus their respective lighting treatments (Table 1).
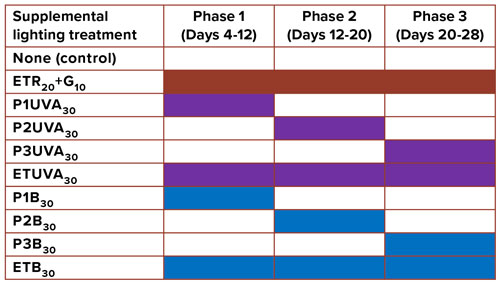 Table 1. Supplemental lighting treatments were applied to lettuce plants during Phase 1 (P1), Phase 2 (P2), Phase 3 (P3) or all three phases (entire time; ET) of the experiment except for the control treatment, which had no supplemental lighting. Each treatment consisted of additional light from ultraviolet-A (UVA; 315 to 399 nm), blue (B; 400 to 499 nm), or red (R; 600 to 699 nm) plus green (G; 500 to 599 nm) LEDs. Subscript values indicate the supplemental photon flux density of each waveband, in µmol∙m–2∙s–1.
On Day 12, the lettuce seedlings were transplanted into a deep-flow hydroponics system with a recirculating nutrient solution (150 ppm N) and the same environmental conditions. The lighting treatments consisted of supplemental UVA light or blue light at 30 µmol∙m–2∙s–1 for one of three eight-day phases or continuously (all phases). Another lighting treatment was continuous supplementation of 10 µmol∙m–2∙s–1 of green plus 20 µmol∙m–2∙s–1 of red light from LEDs. Light treatment phases consisted of Phase 1 (P1; Days 4 to 12), Phase 2 (P2; Days 12 to 20), Phase 3 (P3; Days 20 to 28) or during the entire production cycle [entire time (ET)].
Our findings
The fresh mass (yield) of lettuce was measured at the end of the production cycle, 28 days after the seeds were sown. UVA or blue light applied during one of the three phases of production didn’t affect lettuce yield, except for blue light applied during the first phase (treatment P1B30; Figure 1). Lettuce yield was the lowest when supplemental blue light was applied during the entire production cycle. The addition of UVA had no significant effect on yield, regardless of when it was delivered. However, fresh mass of lettuce grown under additional red plus green light (treatment ETR20+G10) was greater than plants under the control treatment.
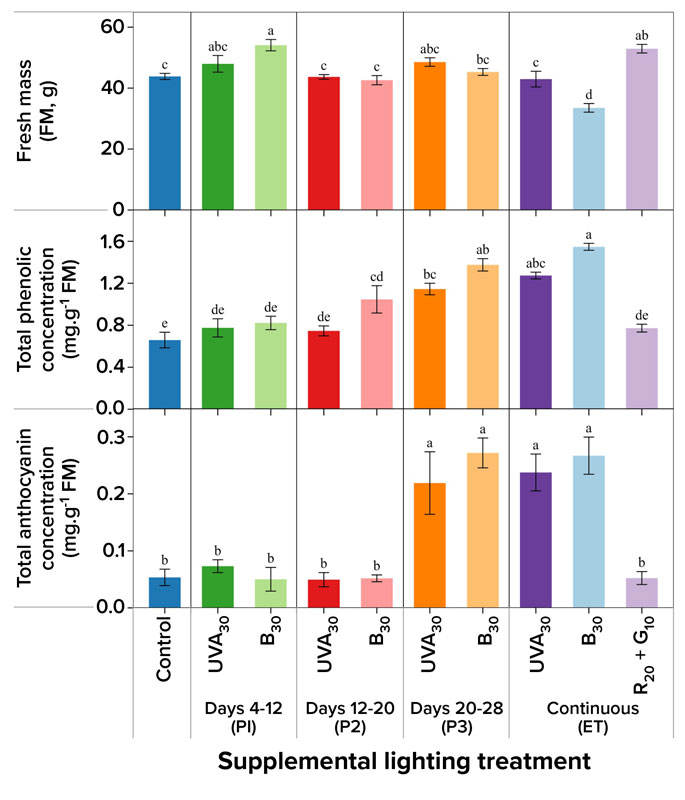 We also measured the total phenolic and anthocyanin concentrations. Compared to no supplemental lighting, UVA and blue light applied at the end of production (P3) or during the entire production cycle greatly increased phenolic and anthocyanin concentrations (Figure 1). Additionally, applying EOP UVA or blue light was similarly effective at increasing concentrations compared to the same spectrum applied for the entire production period. The increase in anthocyanins also led to an increase in leaf redness and blue light was more effective at increasing leaf redness than UVA light (Figure 2). Therefore, elevating UVA and especially blue light at the EOP can increase plant nutritional quality and coloration to a similar extent as the continuous application of the same spectrum.
Finally, light applied during P1 or P2 had little to no effect on lettuce yield or quality at harvest. For example, enriching blue light during P1 increased anthocyanin concentration when measured at the end of P1, but the effect was transient and the P1 treatment had no effect when plants were measured at harvest.
Key takeaways
Applying UVA or blue light at the end of the production cycle or continuously similarly increased lettuce nutritional quality and leaf coloration compared to a light spectrum with little blue light and no UVA light. Supplementing the light spectrum during one of the first two phases had no effect at harvest. Additionally, EOP UVA or blue light didn’t inhibit yield, while supplemental blue light for the entire production cycle did. Therefore, enriching the spectrum with UVA or especially blue light at the EOP can maximize yield and increase leaf color and crop quality.
Nathan Kelly recently completed his Ph.D. in Horticulture at Michigan State University (MSU) and Erik Runkle is a Professor and Extension Specialist in the Department of Horticulture at MSU. This research was supported by the Specialty Crops Research Initiative (grant no. 2019-51181-30017) and Hatch project 192266 from the United States Department of Agriculture National Institute of Food and Agriculture. For more information on this project, visit scri-optimia.org. The authors thank Ryan Warner, Viktorija Vaštakaitė-Kairienė and Mckenna Merkel for experimental assistance.
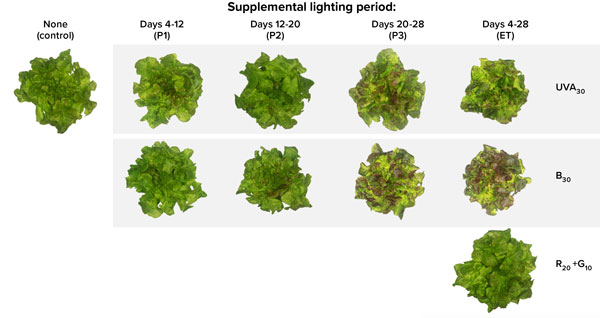
Figure 1. Average shoot fresh mass (g) and total phenolic or anthocyanin concentration on a fresh mass (FM) basis of lettuce Rouxai. Plants were grown indoors without (control) or with supplemental ultraviolet-A (UVA, 315 to 399 nm), blue (B; 400 to 499 nm), green (G; 500 to 599 nm) and/or red (R; 600 to 699 nm) light during one of three eight-day phases (P1, P2, P3) or the entire time (ET). Subscript values indicate the supplemental photon flux density of each waveband, in µmol∙m–2∙s–1. Average values with different letters are significantly different. Error bars indicate the standard error of each treatment.